
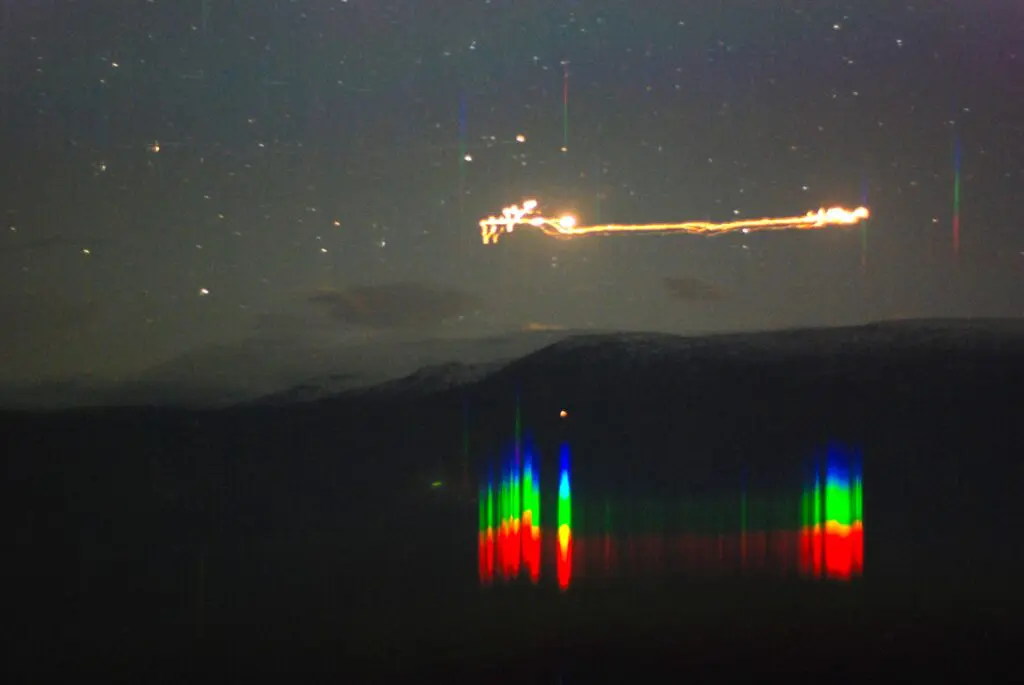
Hessdalen is a small valley in central Norway that has, for decades, produced recurring reports of unusual luminous phenomena, often at low altitude and sometimes close to homes, roads, and the valley floor. People call them “the Hessdalen lights,” but that label can mislead: it suggests one tidy phenomenon with one tidy cause. The record is messier than that.
What makes Hessdalen unusually important in UAP research is not a single dramatic night. It is the combination of recurrence, firsthand testimony from locals and visiting researchers, and the fact that multiple teams have repeatedly tried to instrument the valley. The 1984 “Project Hessdalen” field campaign built a temporary field laboratory with cameras and sensors, while the later Hessdalen Automatic Measurement Station (AMS), often nicknamed the “Blue Box,” aimed for something closer to continuous monitoring. (old.hessdalen.org)
This article is an explainer in the strict sense: what witnesses say they saw, what the best-known studies and project documents claim they measured, where the most contested points are, and why Hessdalen remains scientifically interesting even when many individual sightings can be explained as ordinary lights.
Where Hessdalen is, and why “repeatable geography” matters
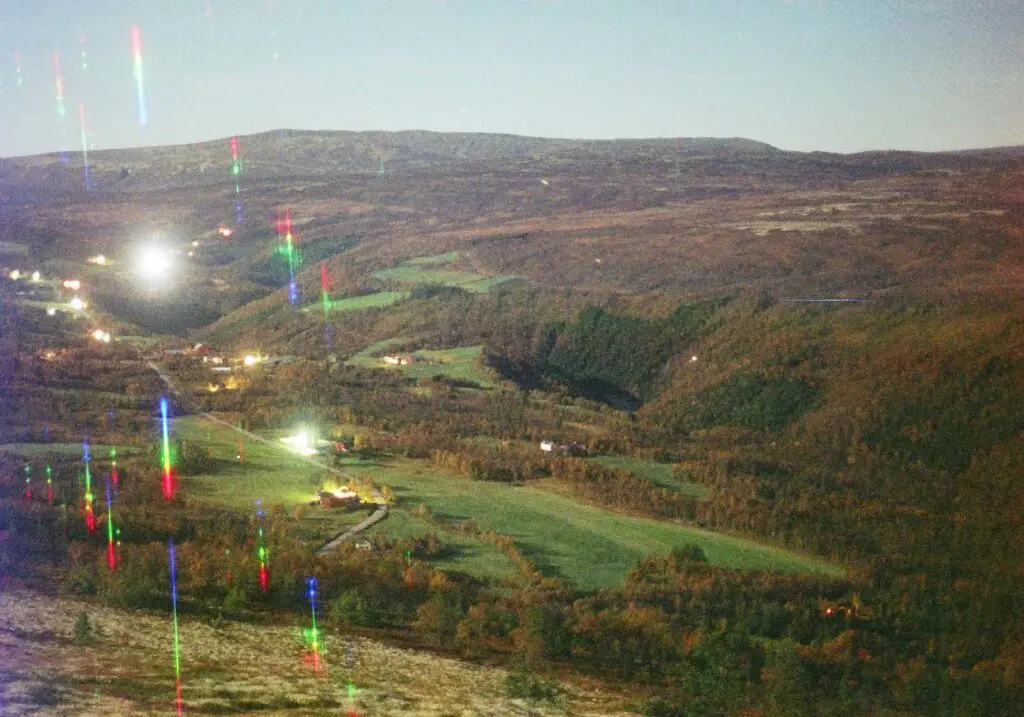
Project Hessdalen’s 1984 technical report opens by situating the valley plainly: Hessdalen is southeast of Trondheim and about 30 km northwest of Røros, roughly 12 km long, with around 150 residents (as described at the time). (old.hessdalen.org)
Those numbers matter because they point to a key feature of Hessdalen’s evidentiary value. It is not a crowded urban air corridor where misidentifications pile up uncontrollably. It is a comparatively small, dark-sky valley where repeated observation is feasible. That is why it became a test case for “instrument the hotspot” rather than “argue about a one-off.” UAPedia’s own framing of high-strangeness hotspots emphasizes this advantage: recurring locales allow prospective, sensor-based study rather than purely retroactive reconstruction. (UAPedia)
The modern wave: December 1981 to the mid-1980s
The modern Hessdalen story is usually dated to late 1981, and that is not just journalistic habit. The 1984 Project Hessdalen report states directly: “In December 1981, unknown lights suddenly started to show up.” (old.hessdalen.org)
In the same early section, the report also describes the behavior that quickly made the valley famous: lights that could remain stationary for long periods, move slowly, stop, and sometimes show large speed or acceleration. (old.hessdalen.org)
A separate project summary letter (distributed later, but reflecting the project’s own long-term accounting) says that during the peak period there “could be up to 20 observations a week,” that this high-activity period lasted until late 1984, and that later the annual frequency was “in the order of 20 observations a year.” This is best treated as a project-reported estimate rather than an independently audited census, but it is still valuable as a window into how residents and researchers experienced the rhythm of the wave. (old.hessdalen.org)
One detail that sometimes gets flattened in popular accounts is that the activity did not remain constant even during the early years. The 1984 report notes a downturn in reports in spring 1983 and mentions seasonal differences, including the practical point that near-continuous summer daylight reduces nighttime observing. (old.hessdalen.org)
Earlier historical mentions, handled carefully
Later scientific summaries and geophysical studies sometimes cite older historical references, including claims of an early 19th-century report and late 19th-century “fireball” notes. A 2024 Journal of Applied Geophysics paper, for example, frames Hessdalen as a long-running case and references earlier historical context in its introduction. (ScienceDirect)
Still, the strongest evidence base for Hessdalen is the 1980s onward, when documentation becomes denser and instrumented campaigns become possible. It is more responsible to describe older mentions as reported antecedents that may relate to the modern phenomenon, rather than as continuous proof that the “same” events were happening unchanged across centuries.
What witnesses report, in their own practical language
The Hessdalen record is full of vivid descriptions, but the most useful ones tend to be the least theatrical. They are the accounts that include location, duration, apparent structure, and comparison with ordinary lights.
Project Hessdalen’s 1984 report provides a descriptive snapshot of what residents reported in the early wave: lights that could be near roofs or just above the ground; lights below mountaintops; shapes on photos described as “bullet,” “football,” or an upside-down “Christmas-tree,” with mostly white or yellow-white coloration and occasional red components. (old.hessdalen.org)
That is the “big picture.” Now consider a few specific cases logged by the project as witness testimony.
On 23 November 1998, Bjarne and Hallfrid Lillevold were driving toward Finnsådalen when they reported seeing a large light north of their cottage, “like a Christmas-tree” illuminating the forest beneath it. They reported two rings, with the upper ring slowly fading after about four minutes, then the lower ring weakening before the whole light vanished. They left the car to observe. The report is short, but it is structured: rings, timed fading, illumination on the forest, and a clear end. (old.hessdalen.org)
On 4 September 1998, Anni Lieskar and four friends, driving at night, reported seeing a green light coming from the left near a road curve, close enough that they braked. They reported it changing color from green to red before disappearing behind trees. The project log notes the event received newspaper coverage. The important point here is not to declare what it “was,” but to recognize what the witnesses are saying: proximity, color shift, brief duration, and the feeling of being close to the roadway rather than high in the sky. (old.hessdalen.org)
On 22 March 1998, Bjarne Lillevold reported an orange triangular light moving fast northward, with a white light at the top and in the middle of the flat side, disappearing near Aspås. Again, the project record presents this as testimony, not as a solved event. The triangle description is noteworthy because it is a geometric claim, and geometric claims are easier to test against common misidentifications than vague “glows.” (old.hessdalen.org)
If you want a sense of how similar descriptions appear during the early high-activity years, the project’s 1982 observation logs include a Christmas Eve report (24 December 1982) from multiple witnesses describing a “shiny ball, football size,” at a distance of about 2 km, moving south, stopping over Nesvold for roughly ten minutes, then disappearing further south. This is the kind of account that sits in the gray zone between atmospheric light phenomena and “object-like” interpretation: a sustained stop, a localized path, and a small apparent size. (old.hessdalen.org)
On 12 December 1982, another entry describes a “shiny spherical object” heading toward Vårhuskjølen, stopping, then heading south again at an altitude estimated around 300 meters, with a note that it “encountered a scheduled flight” further south. Accounts like this are imperfect, because altitude estimates from the ground are notoriously unreliable without reference measurements, but they still show how often witnesses framed the phenomenon as moving within the valley’s near-airspace rather than as distant astronomy. (old.hessdalen.org)
A crucial editorial discipline here is to keep the roles separate. Witnesses report what they perceived. Researchers try to correlate those reports with measurements. Neither role automatically outranks the other, and neither automatically “wins.”
The 1984 campaign: a field laboratory built around an unknown
Project Hessdalen was “born” on 3 June 1983, according to the 1984 report, and it quickly moved from collecting local reports into planning a field investigation. (old.hessdalen.org)
The main fieldwork ran from 21 January 1984 to 26 February 1984. The report describes a “test weekend,” then a “main period,” with observers divided among field stations and a headquarters. Notably, the report states that the headquarters was a caravan at Aspåskjølen, with most instruments inside. This is not a metaphor. It is a literal mobile lab. (old.hessdalen.org)
The same report also explains why the instrument suite looked the way it did: the phenomenon was largely “reported as light sources,” so the team focused on instruments that could characterize light, electromagnetic changes, radio signals, and possible ground correlations. (old.hessdalen.org)
A later peer-reviewed summary by Hauge (2010) lists the campaign’s instrument types in a straightforward way: spectrum analyzer, seismograph, Geiger counter, magnetograph, and radar, among others. (ScienceDirect) The important point is not that every instrument produced a clean “answer,” but that the campaign attempted multi-parameter observation rather than relying solely on human description.
The 1984 report also notes collaboration and consultation with Norwegian scientific institutions and experts, including people at the Norwegian Defence Research Establishment (NDRE) and universities. That does not automatically validate every conclusion, but it does show the project was trying to connect to mainstream expertise even while working outside formal government sponsorship. (old.hessdalen.org)
Counting “observations”: why different summaries look inconsistent
If you read across Hessdalen sources, you will see different numbers, and it is easy to get confused.
Project Hessdalen’s own homepage summary states that during the 21 January to 26 February 1984 field investigation, “Fifty-three light observations were made.” (old.hessdalen.org)
Hauge’s 2010 Acta Astronautica paper, however, includes a line often quoted in isolation: “In one single week, 53 observations of unexplainable light phenomena were obtained, several confirmed by radar.” (ScienceDirect)
Meanwhile, the 1984 technical report itself states that during the project period, the team obtained 188 reports on different lights, which were then characterized by quality indices. (old.hessdalen.org)
The safest way to hold these together is to recognize that they likely reflect different definitions and counting filters: “reports” versus “observations,” and “unexplainable” versus all logged events. What matters for an explainer is not to force one number to erase the others, but to be transparent that Hessdalen’s dataset includes layers: raw reports, higher-quality observations, and a smaller set of cases treated as anomalous by the investigators.
The radar-speed claim, stated as a claim
The most frequently cited controversial measurement from the 1984 report is the statement that “at one time a speed of about 8500 m/s was tracked by radar.” (old.hessdalen.org)
This line is real, and it is important, but it is also exactly the kind of sentence that needs careful framing.
First, it is a project-reported radar estimate, written in the report’s introductory description of reported behavior. It is not presented there as a fully reconstructed trajectory with error bars and a full methodological appendix in the introduction itself. Second, even if a radar system reports a high-speed track, the physical interpretation is not automatically “a solid craft traveled at that speed.” Radar can produce complex artifacts depending on geometry, multipath effects in a valley, and the nature of the reflecting target. Third, Hessdalen researchers themselves have long treated such points as disputed, not as closure.
Teodorani’s widely cited 2004 synthesis captures the broader pattern more cautiously: Norwegian researchers found an apparent correlation of luminous phenomena with magnetic perturbations, radio emission, and radar tracks, and this motivated further analysis and additional expeditions, but the same paper emphasizes that a definitive, quantitatively complete theory “cannot be constructed yet” even if some observations may fit ball-lightning-like electrochemical models. (ADS)
So the best explainer phrasing is simple: the 1984 report includes a radar-tracked speed claim that remains disputed in interpretation, and it is one of several reasons Hessdalen stayed scientifically interesting rather than being dismissed as mere folklore.
From “go out and look” to “let the station watch”: the AMS Blue Box
In UAP research, the most fragile component is human availability. People get tired. Weather changes. A rare event happens when nobody is looking. Hessdalen’s response to that weakness is one of its greatest contributions: build a system that watches continuously.
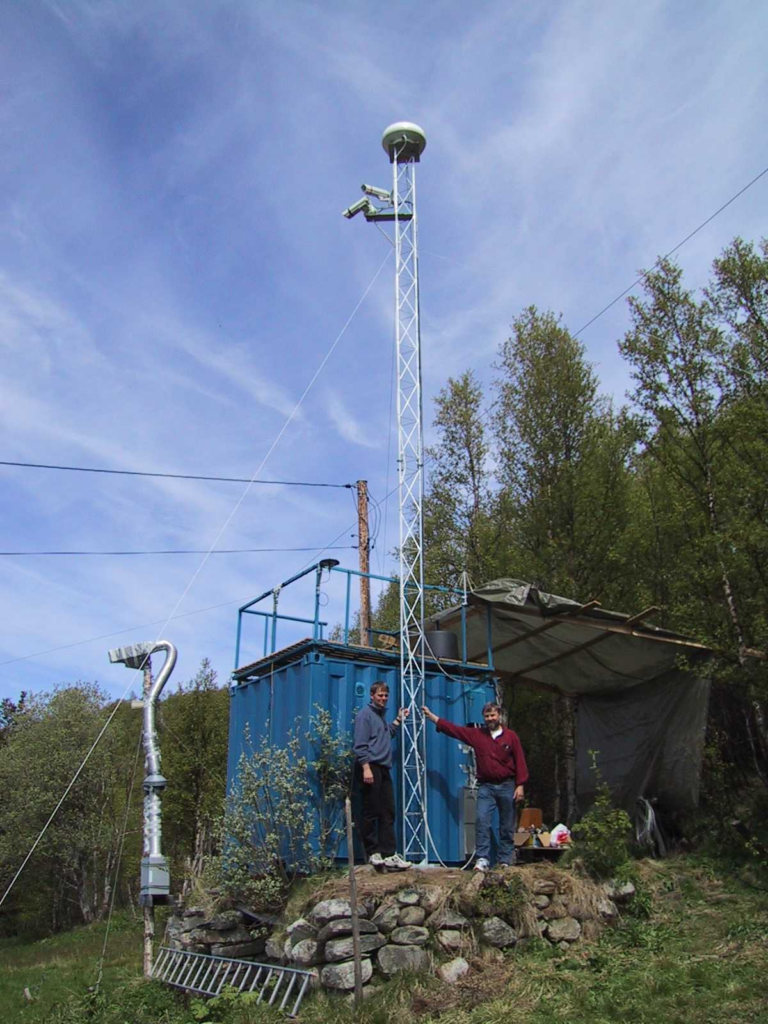
Project Hessdalen’s AMS documentation states that “Hessdalen AMS, system 1, was set into operation, 7th August 1998, at 10 o’clock PM.” It describes the early setup as a black-and-white CCD camera connected to a computer and a video recorder, plus a magnetometer connected to another computer. When a sudden light appeared, an “alarm picture” would be sent to the web and the video recorder would run briefly to capture the event. (old.hessdalen.org)
This is not just a technical footnote. It changes what “evidence” can look like. Instead of only hearing about a light after the fact, you can capture time-stamped imagery, track false positives, and build a database of recurring patterns. The AMS site also provides geographic specifics for the station’s placement at Vårhus and notes camera direction and coverage. (old.hessdalen.org)
Over time, the station expanded. The AMS page explains that there are three CCD cameras transmitting live video continuously, with directions noted (southwest and northwest from the Blue Box tower, plus another camera in a tree at an upper station). It even specifies camera sensitivity and streaming architecture. (old.hessdalen.org)
The public-facing availability of streams and archives is part of what keeps Hessdalen credible as a research site. It allows independent observers to see the same sky and understand how often ordinary aircraft and ground lights appear, which is essential context for separating misidentification from anomaly.
One note of caution is also warranted: the newer hessdalen.org homepage describes the Blue Box as “the world’s first fully autonomous, multi-sensor anomaly detection system” monitoring since 1998. That may be true in spirit, but “world’s first” claims are hard to verify exhaustively. The safer explainer approach is to treat it as a project claim while focusing on the verifiable part, which is that a multi-sensor monitoring station has operated in the valley since August 1998. (Project Hessdalen)
The EMBLA program: expanding instrumentation and publishing results
Hessdalen’s research story did not stop in 1984 or even 1998. An important bridge between the early Norwegian campaign and later international interest is the Italian-Norwegian EMBLA effort, which aimed to study the electromagnetic behavior of the phenomenon with more specialized equipment.
A key primary document here is “The EMBLA 2000 Mission in Hessdalen,” a PDF hosted in the Project Hessdalen reports archive. It describes an August 2000 expedition, the addition of automated radio instruments for about a month, and a suite of computer-controlled data collection systems intended to record continuously. (Project Hessdalen)
The EMBLA 2000 report also emphasizes that the mission combined instrumentation with “intense sky watching activity” and that luminous phenomena were “repeatedly observed, and sometimes photographed.” (Project Hessdalen)
What is especially useful for an explainer is that the Project Hessdalen site cross-references specific observation notes to the EMBLA 2000 report pages. The year-2000 observation log includes entries naming researchers (including Teodorani, Montebugnoli, Monari, Strand, and Hauge) and describing events in a more structured, quasi-field-notes style, with explicit references back to the EMBLA report pages. Whatever one concludes about the phenomenon’s cause, this is an unusually transparent chain from observation note to published expedition report. (old.hessdalen.org)
The misidentification problem, stated plainly and not defensively
An honest Hessdalen explainer has to say this without flinching: many lights in Hessdalen’s sky are not anomalous.
That is not a concession. It is what long-term monitoring teaches you.
Hauge’s 2007 “Optical spectrum analysis” report explicitly notes that identifying the phenomenon is difficult because it is often mixed up with artificial and natural lights such as cars, airplanes, meteors, and planets, and that spectacular manifestations are rare while modest ones are frequently mistaken for ordinary sources. (ufowaves.org)
This is exactly why Hessdalen’s best evidence is not “every sighting is unexplained.” The best evidence is that, after years of sorting, there appears to remain a residue of cases that investigators themselves treat as anomalous, and that those cases sometimes show multi-sensor correlations in the project’s reporting and later syntheses. (ADS)
Geophysics enters the foreground: conductive zones and mineral context
If Hessdalen is a hotspot, one obvious scientific question is: what is special about the place?
A 2024 paper in the Journal of Applied Geophysics reports results from VLF electromagnetic surveys in the valley. The authors report finding several conductive zones mainly related to mineral deposits (especially sulfides). They note that the surface trace of these conductive zones could suggest an ellipse roughly 6 by 12 km, related to a gabbro intrusion, and they argue these results, combined with other geophysical data, may help explain why the lights appear inside this valley and inform similar surveys elsewhere. (ScienceDirect)
This is not a full mechanism. It does not, by itself, turn geology into luminous balls in the air. But it is one of the most concrete “place-based” advances in years because it tries to characterize Hessdalen as an electrical and conductive environment rather than treating the valley as a blank stage on which mysteries simply occur.
The remaining controversies, without turning them into slogans
Hessdalen’s controversies are not just “believers vs skeptics.” They are technical and methodological.
One controversy is classification: are we dealing with one phenomenon that changes appearance, or multiple phenomena grouped under one label? Even the 1984 report describes different categories of reported lights and notes multiple forms and behaviors, which supports the idea that the dataset may include more than one class of event. (old.hessdalen.org)
Another controversy is sensor interpretation. A radar track, a magnetic perturbation, or a radio anomaly is compelling, but only if timing, geometry, and calibration are solid. Teodorani’s 2004 synthesis argues for correlations and discusses possible physical anomalies, while also clearly stating that no fully self-consistent theory exists yet. That tension is the honest center of Hessdalen: correlation is suggestive, but interpretation remains open. (ADS)
A third controversy is cultural and media impact. Peaks of activity attracted attention, visitors, and press coverage, which can both help and harm research. It helps by bringing resources and witnesses. It harms by increasing noise, encouraging “tourist misidentifications,” and tempting headlines that declare the mystery solved or dismissed. The project’s own materials, especially the AMS archives and reports list, quietly resist that cycle by continuing to publish technical descriptions and data resources. (old.hessdalen.org)
Implications: what Hessdalen changes in the larger UAP conversation
Hessdalen’s biggest implication is methodological. It demonstrates what UAP research looks like when it is treated like environmental fieldwork: pick a location with recurrence, instrument it, keep logging, keep publishing, and accept that the dataset will include both misidentifications and anomalies.
This is why Hessdalen shows up again and again in discussions of hotspot strategy and forecasting, including within UAPedia’s own framing of why recurring sites matter. (UAPedia)
If the Hessdalen lights eventually receive a widely accepted natural explanation, the valley still remains valuable as a case study in how to study rare atmospheric luminous phenomena under real-world constraints. If a subset of events continues to resist natural modeling, then Hessdalen remains one of the best places on Earth to test competing hypotheses with continuous monitoring rather than one-off argument.
Either way, the valley’s core contribution is not a single conclusion. It is a research posture: reduce story, increase measurement, keep the witness record intact, and keep interpretation explicitly labeled.
Claims taxonomy
Verified
Recurrent reports of unusual luminous phenomena in Hessdalen since the modern wave beginning in December 1981, documented in project reports and logs, with structured field investigation in early 1984 and an automated monitoring station operating since August 1998. (old.hessdalen.org)
Probable
Some subset of events were regarded by investigators as anomalous after filtering and were pursued with multi-sensor approaches (optical, magnetic, radio, radar) across multiple campaigns, as summarized in peer-reviewed syntheses and project documentation. (ScienceDirect)
Disputed
The physical interpretation of the most dramatic sensor claims, including the report-stated radar-tracked speed of about 8500 m/s, and broader debates about whether any events imply a solid object rather than atmospheric luminous phenomena. (old.hessdalen.org)
Misidentification
A meaningful portion of sightings can be attributed to ordinary light sources (aircraft, vehicles, meteors, planets), and even researchers emphasize how often modest manifestations are confused with natural or artificial lights. (ufowaves.org)
Speculation labels
Hypothesis
Hessdalen as an electrically primed landscape
The 2024 VLF survey results support the idea that Hessdalen contains conductive zones linked to mineralization and structural geology. A reasonable hypothesis is that this conductive environment could contribute to conditions that make unusual luminous events more likely, for example through localized electric fields, discharge processes, or plasma-related effects. This remains a hypothesis because the geophysical mapping does not yet provide a complete causal chain from conductive zones to specific luminous events. (ScienceDirect)
Hypothesis
Plasma-like or combustion-like processes in the lower atmosphere
Teodorani’s 2004 synthesis discusses ball-lightning-like electrochemical models as potentially explaining some observations, while emphasizing that a definitive theory does not yet exist. This is best treated as a partial-fit hypothesis rather than a solved explanation. (ADS)
Witness interpretation
“object-like” structure and proximity
Some Hessdalen witnesses describe geometric shapes, ring structures, and “football-sized” luminous objects with stopping behavior. These accounts can naturally lead witnesses toward “object-like” interpretations. The responsible stance is to preserve those descriptions as testimony while acknowledging that distance and size judgments can be uncertain without instrumented ranging. (old.hessdalen.org)
Researcher opinion
Hessdalen as a training ground for UAP field methods
Across the 1984 campaign, the AMS station design, and the EMBLA-era expeditions, a consistent researcher stance emerges: the phenomenon’s recurrence makes it worth instrumenting, even if the cause remains unclear. This is an opinion grounded in practice, reflected in the continuation of monitoring and publication. (old.hessdalen.org)
Relevant links
Project Hessdalen (main): https://www.hessdalen.org/
Project Hessdalen (archive): https://old.hessdalen.org/index_e.shtml
1984 Technical Report (Strand): https://old.hessdalen.org/reports/hpreport84.shtml
AMS technical description (system 1): https://old.hessdalen.org/station/first.shtml
AMS overview (24/7 cameras): https://old.hessdalen.org/station/
Observation logs (1998): https://old.hessdalen.org/observations/1998/
Observation logs (1982): https://old.hessdalen.org/observations/1982/
Reports archive index: https://old.hessdalen.org/reports/
EMBLA 2000 report (PDF): https://hessdalen.org/reports/EMBLA-2000.pdf
References
Hauge, B. G. (2010). Investigation & analysis of transient luminous phenomena in the low atmosphere of Hessdalen valley, Norway. Acta Astronautica, 67(11–12), 1443–1450. (ScienceDirect)
Hauge, B. G. (2007). Optical spectrum analysis of the Hessdalen phenomenon (Preliminary report). (ufowaves.org)
Strand, E. P. (1984/1985). Project Hessdalen 1984: Final technical report (Part 1). Project Hessdalen archive. (old.hessdalen.org)
Project Hessdalen. (1998). Hessdalen AMS technical description (System 1) and observation logs. (old.hessdalen.org)
Teodorani, M. (2004). A long-term scientific survey of the Hessdalen phenomenon. Journal of Scientific Exploration, 18(2), 217–251. (ADS)
Teodorani, M., Montebugnoli, S., & Monari, J. (2000). The EMBLA 2000 Mission in Hessdalen. Project Hessdalen reports archive. (Project Hessdalen)
Vargemezis, G. N., Zlotnicki, J., Hauge, B. G., Kjøniksen, A.-L., & Strand, E. P. (2024). Contribution of VLF electromagnetic survey to the investigation of Hessdalen lights (Norway). Journal of Applied Geophysics. (ScienceDirect)
SEO keywords
Hessdalen Valley, Hessdalen lights, Norway UAP, Project Hessdalen, Hessdalen AMS, Blue Box Hessdalen, EMBLA Hessdalen, Teodorani Hessdalen, Hauge Hessdalen, VLF survey Hessdalen, conductive zones Hessdalen, gabbro intrusion Hessdalen, anomalous lights Norway, instrumented UAP hotspot, long-term UAP monitoring